| Log In

Conducting Usability Testing: The Key to Building User-Centered Experiences

What is Usability Testing?

At its core, usability testing is the process of evaluating a product or service by testing it on real users. It focuses on understanding how actual users interact with your design and identifying pain points that could hinder their experience. Whether you’re testing a website, app, or software, usability testing helps uncover issues that would otherwise remain hidden until after launch, when it’s often too late—or too costly—to fix.

Why Usability Testing Matters

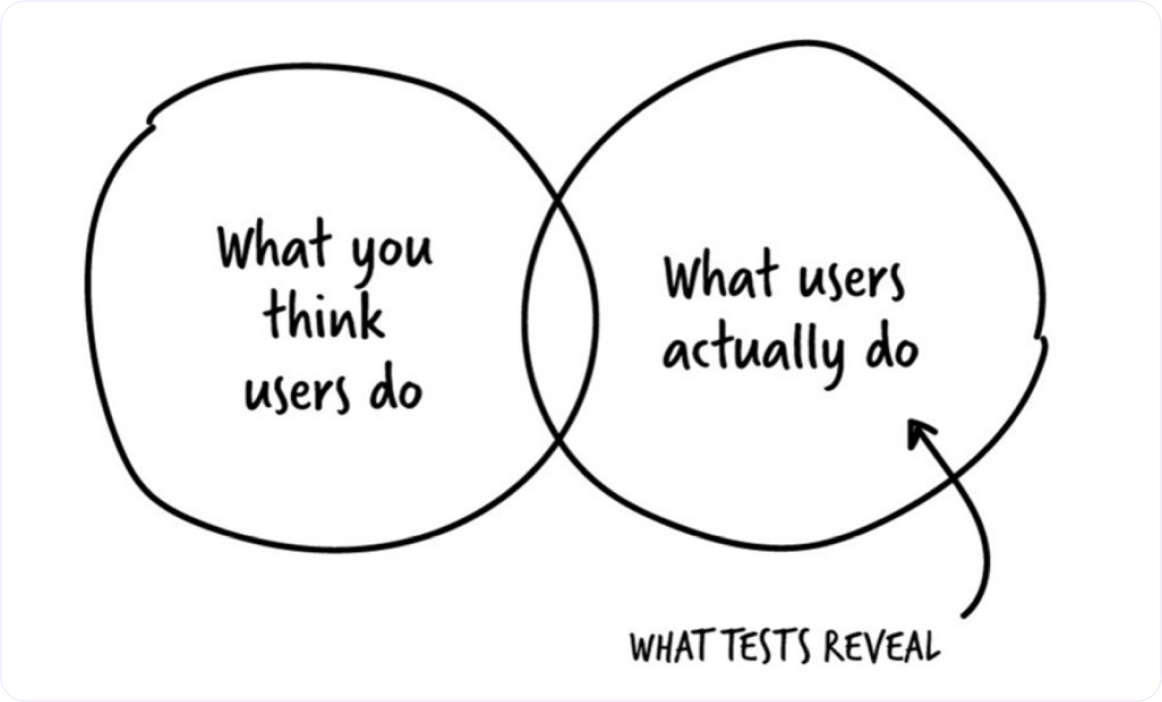
User research is a critical part of the design process, but it often relies on assumptions and theoretical knowledge about the user. Usability testing, on the other hand, shows you how users behave in real-time scenarios. Here’s why it’s essential:

  • Validates Design Choices: No matter how user-friendly you think your design is, real users may think differently. Usability testing helps validate your design decisions by providing concrete feedback.
  • Reduces Costly Errors: Catching usability issues early in the design process can save you time and money down the road, preventing costly post-launch fixes.
  • Improves User Satisfaction: A well-designed product that is easy to use leads to happier users, which in turn drives higher user retention, conversion rates, and engagement.

Types of Usability Testing

There are several approaches to usability testing, each serving different goals and scenarios. Here are some of the most common:

1.Moderated vs. Unmoderated Testing:

  • Moderated testing involves a facilitator guiding the user through tasks and asking questions during the session. It allows for deeper insights and real-time feedback.
  • Unmoderated testing, on the other hand, allows users to complete tasks on their own without a facilitator present, often through an online tool, providing a more natural user experience

2.Remote vs. In-Person Testing:

  • Remote testing enables users to test your product from the comfort of their own environment, providing insights into how they interact with your design in real-world settings.
  • In-person testing allows the facilitator to observe subtle user behaviors, such as facial expressions and body language, providing more qualitative feedback.

3.Qualitative vs. Quantitative Testing:

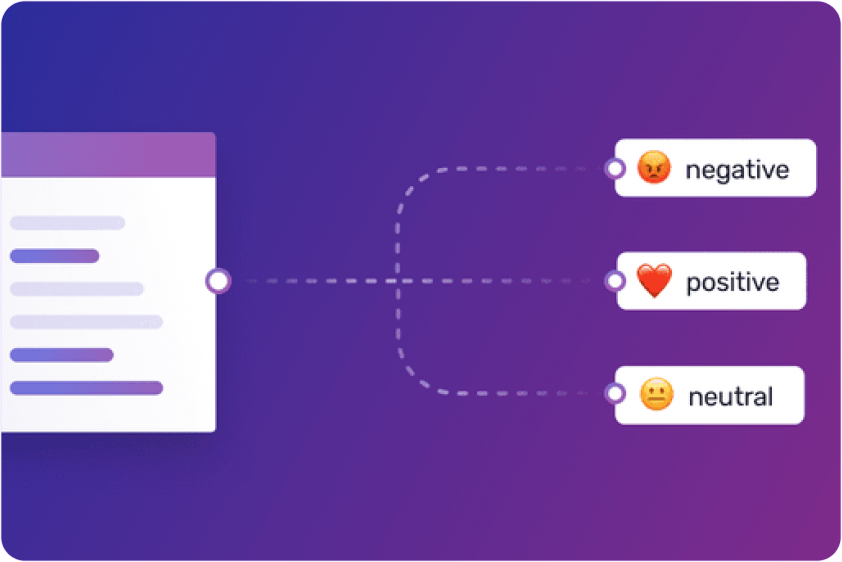
  • Qualitative testing focuses on observing user behavior and identifying pain points through open-ended feedback.
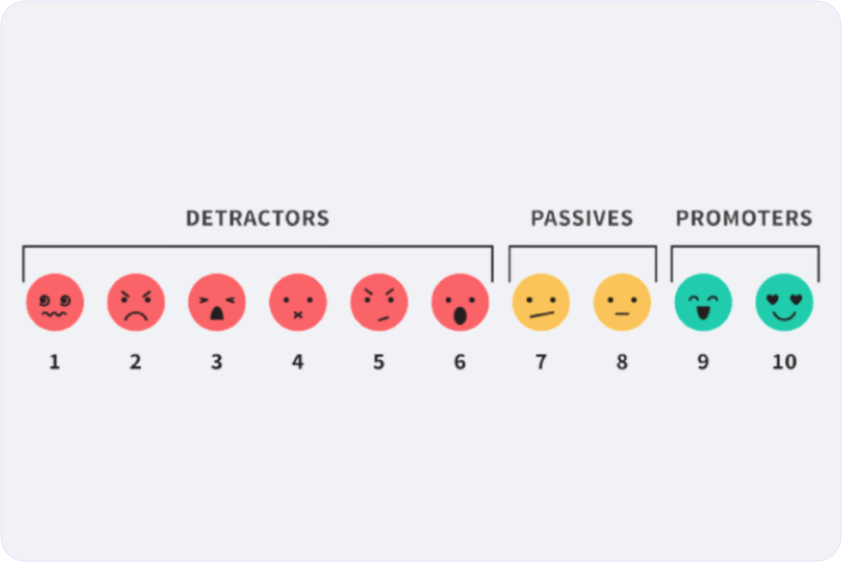
  • Quantitative testing collects measurable data, such as task completion rates and error rates, to provide actionable insights backed by metrics.

How to Conduct Effective Usability Testing

  1. Set Clear Goals:
    Before conducting a usability test, identify what you’re hoping to achieve. Are you looking to improve navigation, streamline a specific task, or assess overall usability? Clear goals will help you craft the right questions and define success metrics.
  2. Define User Personas:
    Make sure the participants of your usability test accurately represent your target audience. Developing detailed user personas ensures you’re testing with users who reflect your actual user base, leading to more relevant insights.
  3. Create Realistic Scenarios and Tasks:
    Usability tests are most effective when they mirror real-world usage. Instead of giving participants generic tasks, frame scenarios that mimic how users would naturally interact with your product. For example, if you’re testing an e-commerce site, create tasks like “Find and purchase a pair of shoes under $50.”
  4. Observe, Don’t Intervene:
    When facilitating a usability test, the goal is to observe how users interact with your design, not guide them. Refrain from offering hints or correcting mistakes. This will give you valuable insights into potential usability issues that need to be addressed.
  5. Analyze and Act on Findings:
    After conducting your test, the next step is to analyze the results. Look for patterns in user behavior, track common pain points, and prioritize fixes based on their impact on usability. Finally, incorporate these insights into your next design iteration.

Common Mistakes to Avoid in Usability Testing

  • Testing too late: Waiting until the product is fully developed to conduct usability testing limits your ability to implement meaningful changes. Conduct tests early and often during the design process.
  • Using the wrong participants: Make sure your test participants reflect your actual user base. Testing with people who don’t fit your target audience can lead to inaccurate conclusions.
  • Not asking the right questions: Avoid asking leading questions that could influence how users interact with the design. Stick to open-ended questions that encourage honest feedback.

The Art of Color: Mastering the Power of Hue in Product Design

Why Color Matters in Product Design

When it comes to product design, color has the power to influence user perception and behavior. In fact, up to 85% of consumers cite color as a primary reason for why they choose a product. Color can evoke emotions, set the tone, and communicate key messages without a single word. For product designers, understanding how to leverage the psychology of color is critical for creating experiences that resonate on a deeper level.

The Psychology of Color: Understanding Emotions and Actions

The first thing users notice about your product is its color. Colors set the mood and tone immediately, influencing users’ first impressions. Consider the emotional impact of different hues:

  • Warm tones (Red, Orange, Yellow): Energetic and attention-grabbing – ideal for products that need to convey urgency or action.
  • Cool tones (Blue, Green, Purple): Calming and trustworthy – perfect for products associated with health, finance, or technology.
  • Neutrals (Gray, Black, White): Minimalist and sophisticated – great for high-end or sleek product lines.

By aligning the emotional impact of color with your product’s purpose, you can create designs that connect with users from the moment they engage.

Guiding User Interaction with Color

Color plays a critical role in user experience by guiding interactions. It can highlight important features, buttons, and actions. For example:

  • Calls to Action (CTAs): Make sure your CTAs stand out by using bold, contrasting colors that draw attention.
  • Error States: Using red for error messages or warnings is a universal convention, signaling urgency or caution.
  • Success Messages: Green is often associated with success or completion, making it a popular choice for confirmation messages.

A well-designed product uses color intentionally to enhance user interactions, not overwhelm them.

Creating Visual Hierarchy with Color

Effective color use helps to establish a visual hierarchy, ensuring that users know where to look and what to focus on. By combining complementary colors and using variations in tone, you can create contrast and highlight key elements of the design. For instance:

  • Accent Colors: Use these sparingly to draw attention to specific areas like primary buttons or important information.
  • Background and Text Colors: Ensure there is enough contrast between your background and text colors to make content legible and accessible to all users.

Mastering this balance will help users navigate your product intuitively.

Designing for Accessibility: Color for All Users

One of the most important aspects of using color in design is ensuring accessibility. Not all users perceive color the same way, so it’s essential to design with inclusivity in mind:

  • Color Contrast: Ensure that text and background colors have enough contrast for readability.
  • Colorblind-Friendly Palettes: Avoid relying solely on color to convey information. Use texture, icons, or patterns to distinguish elements for those with color vision deficiencies.
  • Testing for Accessibility: There are various tools available to test the color accessibility of your design. This step ensures your product can be used by the widest possible audience.

Color and Branding: Building Identity Through Consistency

Color is a cornerstone of brand identity. Just think of the bright red of Coca-Cola or the iconic blue of Facebook. Consistency in color usage not only reinforces brand recognition but also helps solidify trust with users. In product design, this means using brand colors consistently across all touchpoints, from your UI elements to marketing materials. A cohesive color scheme builds familiarity and ensures your product feels like a natural extension of your brand.

Balancing Psychology, Usability, and Aesthetics

The best product designs strike a perfect balance between emotional impact, functionality, and visual appeal. By understanding the psychology of color and applying it effectively in your design choices, you can create products that not only look good but also feel good to use.

Whether you’re guiding user actions, creating a seamless hierarchy, or building brand identity, color is the unspoken language that makes it all possible. When used thoughtfully, it elevates the user experience, turning a functional product into something memorable and meaningful.


Storytelling in UX: Creating Narratives That Engage and Guide Users

Why Storytelling Matters in UX

Storytelling is a fundamental part of human communication, helping us make sense of complex information and form emotional connections. In UX design, storytelling transforms mundane tasks into compelling experiences. It allows designers to craft journeys that evoke emotions, making the user feel like an integral part of the product’s narrative.

  • Storytelling helps guide users intuitively through complex processes.
  • It builds emotional connections that enhance user engagement and retention.
  • Narratives can humanize digital experiences, making products more relatable and memorable.

Example:

Consider the onboarding process of a fitness app. Instead of simply asking for details, the app creates a story by positioning the user as a “hero” embarking on a health journey. By framing features as “tools” for the user’s success, the app turns an otherwise standard setup process into a motivating story that keeps users engaged.

Elements of Storytelling in UX Design

Successful storytelling in UX relies on key narrative elements: characters, conflict, resolution, and setting. When these elements are infused into design, they help structure the user journey in a way that feels engaging and purposeful.

  • Characters: Users should see themselves as the main character, with the product acting as a guide (like Yoda in Star Wars!).
  • Conflict: Addressing user pain points and presenting challenges keeps users interested.
  • Resolution: The product offers solutions, showing users how it resolves their problems.
  • Setting: The UI and branding set the tone, much like a story’s world-building. Visuals, typography, and language all contribute to the mood of the user journey.

Example:
Airbnb’s website is a masterclass in storytelling. It focuses on the user as the main character—whether they’re a traveler seeking adventure or a host offering their home. The conflict is solved by matching travelers to their ideal destinations and homes, all while maintaining an aesthetically cohesive “setting” that reflects the brand’s warm, inviting ethos.

Practical Ways to Incorporate Storytelling into UX Design

Storytelling doesn’t need to be grandiose; small, thoughtful details can make a big difference in creating a narrative for your users. Here are some practical ways to weave storytelling into your designs:

  • User Journeys: Map out the user’s story arc. This can be as simple as identifying the starting point (awareness), the challenge (using the product), and the resolution (achieving their goal).
  • Microcopy and Visuals: Use microcopy to convey the narrative. Friendly, conversational language and storytelling visuals (e.g., illustrations, animations) make the journey more personal and relatable.
  • Progress Indicators: Show users how far they’ve come and what’s left to achieve, just like chapters in a story. It reassures them that they are progressing and motivates them to reach the “end.”
  • Onboarding and Tutorials: Tell a story during onboarding by guiding users through an experience that gradually introduces them to your product. Focus on small wins and success milestones along the way.

Example:
Duolingo, a language-learning app, excels in storytelling by incorporating gamification and progress tracking. The app positions learning as a challenge, with users achieving small victories (badges, rewards) as they progress through lessons. This creates an engaging narrative that keeps users motivated to continue their learning journey.

The Emotional Impact of Storytelling

At its core, storytelling is about emotion. Successful UX storytelling makes users feel something, whether it’s joy, excitement, empathy, or relief. By designing experiences that evoke specific emotions, you create a stronger connection between the user and the product.

  • Emotional engagement increases user satisfaction and loyalty.
  • A well-told story encourages users to spend more time interacting with your product.
  • Users are more likely to recommend and remember products that emotionally resonate with them.

Example:
Slack, the workplace communication tool, humanizes its product with playful, humorous messaging. By infusing their product with warmth and personality, Slack creates an emotional bond with users, transforming what could be a dry, corporate tool into something people genuinely enjoy using.


Measuring UX Success: Key Metrics and KPIs

Beyond the Basics: Advanced UX Metrics You Should Be Tracking

When it comes to measuring UX success, most people are familiar with basic metrics like bounce rate or page views. However, to truly understand the impact of UX design, it’s important to go beyond these surface-level metrics and track more advanced indicators:

  • Customer Effort Score (CES): Measures how much effort users have to exert to achieve their goals. A lower CES indicates a smoother, more intuitive user experience.
  • Task Completion Rate: Tracks the percentage of users who successfully complete a specific task. High completion rates often correlate with well-designed interfaces.
  • Time on Task: Measures how long it takes users to complete a task. While efficiency is key, it’s also important to ensure that the time spent reflects a positive, engaging experience.

By focusing on these advanced metrics, UX teams can gain deeper insights into the effectiveness of their designs.


From Numbers to Narratives: How to Tell the Story of UX Success

While metrics provide valuable data, numbers alone don’t always resonate with stakeholders. To truly convey the impact of UX design, it’s essential to turn data into compelling narratives:

  • Link Metrics to User Stories: Illustrate how UX improvements have directly enhanced user experiences by connecting metrics to real-life user stories.
  • Visualize Success: Use data visualization techniques like charts, graphs, and infographics to present metrics in a way that’s easy to understand and compelling.
  • Highlight Impact on Business Goals: Show how UX metrics align with and contribute to broader business objectives, such as increased sales, higher customer retention, or improved brand perception.

By crafting a narrative around your metrics, you can more effectively communicate the value of UX design to stakeholders.

The ROI of UX: Quantifying Success in Dollars and Sense

One of the most powerful ways to demonstrate UX success is by quantifying its financial impact. Metrics like conversion rates and customer lifetime value (CLV) can provide tangible evidence of the ROI (Return on Investment) of UX design:

  • Conversion Rate: Measures the percentage of users who complete a desired action, such as making a purchase or signing up for a newsletter. Improvements in UX design often lead to higher conversion rates, directly impacting revenue.
  • Customer Lifetime Value (CLV): Calculates the total revenue a business can expect from a single customer over their entire relationship. A better UX can lead to higher customer satisfaction and loyalty, increasing CLV.

By translating UX success into financial terms, you can make a strong case for continued investment in UX design.

User Happiness: The Ultimate UX KPI?

While metrics like conversion rates and task completion are important, there’s a growing argument that user happiness might be the ultimate KPI for UX success. After all, a product that leaves users happy is likely to see higher engagement, loyalty, and advocacy:

  • Net Promoter Score (NPS): Measures how likely users are to recommend a product to others. A high NPS often indicates strong user satisfaction and happiness.
  • User Satisfaction Surveys: Direct feedback from users can provide insights into their overall happiness with the product.
  • Emotional Response Tracking: Using tools like sentiment analysis, designers can gauge the emotional responses users have to different aspects of the product.

By focusing on user happiness, UX teams can ensure that their designs not only meet functional needs but also create positive, memorable experiences.

Decoding UX Metrics: Turning Data into Actionable Insights

Collecting UX metrics is one thing, but the real challenge lies in interpreting the data and turning it into actionable insights:

  • Identify Patterns: Look for trends and patterns in the data that can reveal underlying issues or opportunities for improvement.
  • Benchmark Performance: Compare metrics against industry standards or past performance to understand how well the product is doing.
  • Prioritize Issues: Use the data to identify and prioritize the most critical issues that need addressing, ensuring that efforts are focused where they will have the greatest impact.

By decoding UX metrics, designers can make informed decisions that lead to continuous improvement and long-term success.

The UX Dashboard: Building a Real-Time View of Success

A UX dashboard is a powerful tool for tracking key metrics in real-time, offering ongoing visibility into UX performance. Here’s how to build an effective UX dashboard:

  • Select Key Metrics: Choose the most relevant metrics to track, such as task completion rates, NPS, and user retention rates.
  • Use Visual Tools: Employ data visualization tools to present metrics in a clear, intuitive way that’s easy to monitor at a glance.
  • Customize for Stakeholders: Tailor the dashboard to the needs of different stakeholders, ensuring that each group has access to the metrics that matter most to them.

With a well-designed UX dashboard, teams can stay informed and agile, making real-time adjustments to optimize the user experience.

Beyond Clicks and Scrolls: Measuring Emotional Engagement in UX

Emotional engagement is a critical yet often overlooked aspect of UX success. While clicks and scrolls provide data on user behavior, emotional engagement offers insights into how users feel about the product:

  • Sentiment Analysis: Tools like sentiment analysis can track user emotions based on their interactions, revealing how users truly feel about the product.
  • Engagement Metrics: Monitor metrics like session duration, repeat visits, and interaction rates to gauge how emotionally engaged users are with the product.
  • Qualitative Feedback: Conduct interviews or focus groups to gather direct feedback on users’ emotional experiences with the product.

By measuring emotional engagement, UX teams can ensure that their designs resonate on a deeper level with users, fostering stronger connections and loyalty.

From Analytics to Action: Using UX Metrics to Drive Design Decisions

Data should never just sit in a report; it should drive action. Here’s how to use UX metrics to inform and guide design decisions:

  • Iterative Design: Use metrics to inform the iterative design process, making incremental improvements based on data-driven insights.
  • User-Centered Adjustments: Let user feedback and behavior data guide adjustments to the design, ensuring that changes align with user needs and preferences.
  • A/B Testing: Conduct A/B tests to compare different design variations, using metrics to determine which version performs better and why.

By letting metrics guide the design process, UX teams can ensure that their decisions are grounded in reality and focused on delivering the best possible user experience.

Holistic UX Measurement: Balancing Quantitative and Qualitative Metrics

To get a full picture of UX success, it’s important to balance quantitative and qualitative metrics:

  • Quantitative Metrics: These include task completion rates, NPS, and conversion rates, which provide measurable data on user behavior and performance.
  • Qualitative Metrics: These include user interviews, open-ended survey responses, and usability testing observations, which offer deeper insights into user experiences and motivations.

By combining both types of metrics, UX teams can gain a holistic understanding of how well their designs are performing and where improvements are needed.

Case Study: How Companies Used UX Metrics to Drive Growth

To illustrate the real-world impact of UX metrics, let’s look at how some companies have successfully used them to drive growth:

  • Amazon: Amazon has long been known for its data-driven approach to UX. By closely monitoring metrics like conversion rates, customer satisfaction, and page load times, Amazon has continually refined its user experience, leading to increased sales and customer loyalty.
  • Spotify: Spotify uses a mix of quantitative data (like user engagement metrics) and qualitative feedback (from surveys and user interviews) to continually optimize its user interface. This data-driven approach has helped Spotify maintain its position as a leading music streaming service, with high user retention and satisfaction rates.
  • Airbnb: Airbnb leverages UX metrics such as booking conversion rates, user feedback, and task success rates to enhance its platform. By making data-informed design decisions, Airbnb has improved its user experience, leading to higher booking rates and user satisfaction.

These case studies demonstrate how UX metrics can be powerful tools for driving business growth when used effectively.

The UX Health Check: Key Metrics for Continuous Monitoring

Regularly assessing the health of a product’s UX is essential for maintaining long-term success. Here’s a checklist of key metrics to monitor continuously:

  • User Retention Rate: Measures how many users return to the product over time, indicating long-term satisfaction and loyalty.
  • Task Success Rate: Tracks the percentage of users who successfully complete key tasks, providing ongoing insights into usability.
  • Error Rate: Measures how often users encounter errors, highlighting potential pain points in the design.
  • User Feedback: Regularly collect and analyze user feedback to stay in tune with user needs and expectations.

By keeping a close eye on these metrics, UX teams can proactively address issues and ensure that the user experience remains strong.

The Importance of User Research in UX Design

What is User Research?

User research is the process of understanding the behaviors, needs, and motivations of users through various research methods. These methods can include surveys, interviews, usability testing, and ethnographic studies. By gathering insights directly from users, designers can make informed decisions that lead to better, more user-centered designs.

User research helps designers empathize with their audience, uncover pain points, and identify opportunities for innovation. Without it, the design process can become a guessing game, often leading to products that fail to meet user expectations.

Why user research is essential?

Informed Design Decisions: User research provides designers with data-driven insights, allowing them to make informed decisions rather than relying on assumptions. This leads to designs that are more likely to meet user needs and expectations.

Efficiency and Cost Savings: By identifying potential issues early in the design process, user research helps prevent costly redesigns and revisions. It ensures that resources are used efficiently, focusing efforts on features and functionalities that truly matter to users.

Improved User Satisfaction: Products designed with user research are more likely to satisfy users, leading to increased engagement, loyalty, and positive word-of-mouth.

Competitive Advantage: In a crowded market, user-centered designs stand out. By prioritizing user research, companies can create products that offer a superior user experience, giving them a competitive edge.

Skipping user research can lead to products that miss the mark, fail to resonate with users, and ultimately, underperform in the market.

User Research in B2B vs. B2C

User research plays a vital role in both B2B (Business-to-Business) and B2C (Business-to-Consumer) contexts, but the approaches and focus areas differ significantly.

B2B User Research

In B2B design, the focus is on understanding the needs of entire organizations rather than individual users. The decision-making process in B2B is often complex, involving multiple stakeholders with different priorities and requirements.

For example, when designing a software tool for businesses, user research might involve understanding specific industry workflows, compliance requirements, and integration needs. The goal is to create a product that not only meets the functional requirements of the business but also aligns with its strategic objectives.

B2C User Research

B2C user research, on the other hand, focuses on individual users and their personal needs, preferences, and behaviors. Emotional factors, usability, and personalization are often more critical in B2C design.

For example, when designing a mobile app for consumers, user research might explore how users interact with the app, what features they find most valuable, and how the design can create an emotional connection with the user. The aim is to create a product that is not only functional but also enjoyable and engaging.

While the core principles of user research remain the same in both B2B and B2C contexts, the methods and goals can differ. B2B research may require more in-depth analysis of workflows and organizational needs, while B2C research often focuses on individual user experiences and emotional engagement.


Understanding these differences is crucial for designers, as it allows them to tailor their research approach to the specific needs of their target audience.

Statistics on User Research in UX Design

To underscore the importance of user research, let’s look at some statistics:

  • Success Rates: According to a study by the Nielsen Norman Group, products that incorporate user research are significantly more successful, with a success rate of 90% compared to just 50% for products that skip user research.
  • Designer Adoption: A recent survey by Adobe found that 76% of UX designers regularly conduct user research as part of their design process. Of those who do not, 45% reported that their projects often face challenges related to user dissatisfaction or usability issues.
  • Impact on ROI: Research by Forrester found that companies that prioritize user research see an average ROI of 301% from their UX design efforts. This demonstrates the tangible value that user research can bring to a business.

These statistics highlight the clear benefits of incorporating user research into the design process. By understanding users’ needs and preferences, designers can create products that not only perform well but also drive business success.

Case Studies and Examples

To illustrate the power of user research, let’s consider a few examples:

  • Slack: The popular communication platform Slack is a prime example of a product designed with user research at its core. By conducting extensive interviews and usability tests, Slack’s designers were able to create a tool that meets the needs of both individual users and large organizations. This user-centered approach has been a key factor in Slack’s widespread adoption and success.
  • Dropbox: Dropbox’s design team conducted user research to understand how people manage and share files across devices. This research led to the development of a simple, intuitive interface that has made Dropbox a favorite among consumers and businesses alike.

These examples demonstrate how user research can lead to innovative, user-friendly products that resonate with their target audience.