Beyond the Basics: Advanced UX Metrics You Should Be Tracking
When it comes to measuring UX success, most people are familiar with basic metrics like bounce rate or page views. However, to truly understand the impact of UX design, it’s important to go beyond these surface-level metrics and track more advanced indicators:
- Customer Effort Score (CES): Measures how much effort users have to exert to achieve their goals. A lower CES indicates a smoother, more intuitive user experience.
- Task Completion Rate: Tracks the percentage of users who successfully complete a specific task. High completion rates often correlate with well-designed interfaces.
- Time on Task: Measures how long it takes users to complete a task. While efficiency is key, it’s also important to ensure that the time spent reflects a positive, engaging experience.
By focusing on these advanced metrics, UX teams can gain deeper insights into the effectiveness of their designs.
From Numbers to Narratives: How to Tell the Story of UX Success
While metrics provide valuable data, numbers alone don’t always resonate with stakeholders. To truly convey the impact of UX design, it’s essential to turn data into compelling narratives:
- Link Metrics to User Stories: Illustrate how UX improvements have directly enhanced user experiences by connecting metrics to real-life user stories.
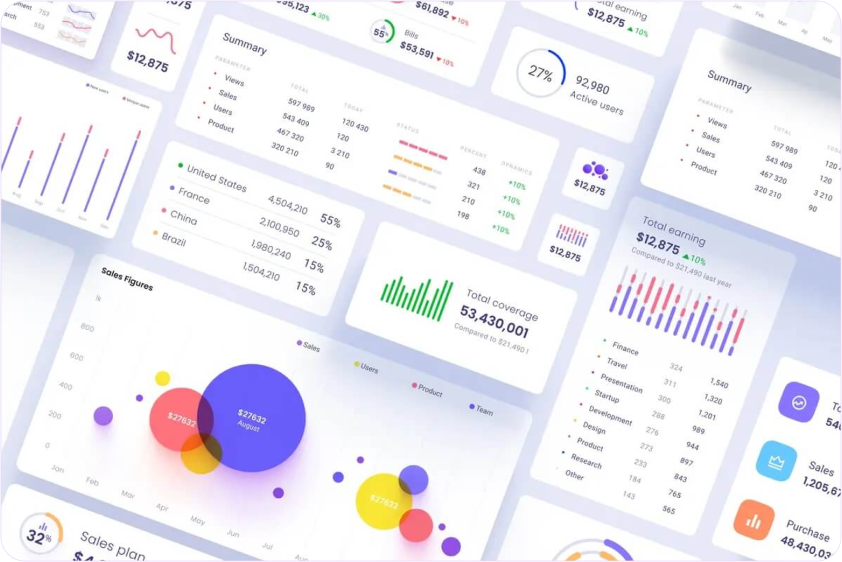
- Visualize Success: Use data visualization techniques like charts, graphs, and infographics to present metrics in a way that’s easy to understand and compelling.
- Highlight Impact on Business Goals: Show how UX metrics align with and contribute to broader business objectives, such as increased sales, higher customer retention, or improved brand perception.
By crafting a narrative around your metrics, you can more effectively communicate the value of UX design to stakeholders.
The ROI of UX: Quantifying Success in Dollars and Sense
One of the most powerful ways to demonstrate UX success is by quantifying its financial impact. Metrics like conversion rates and customer lifetime value (CLV) can provide tangible evidence of the ROI (Return on Investment) of UX design:
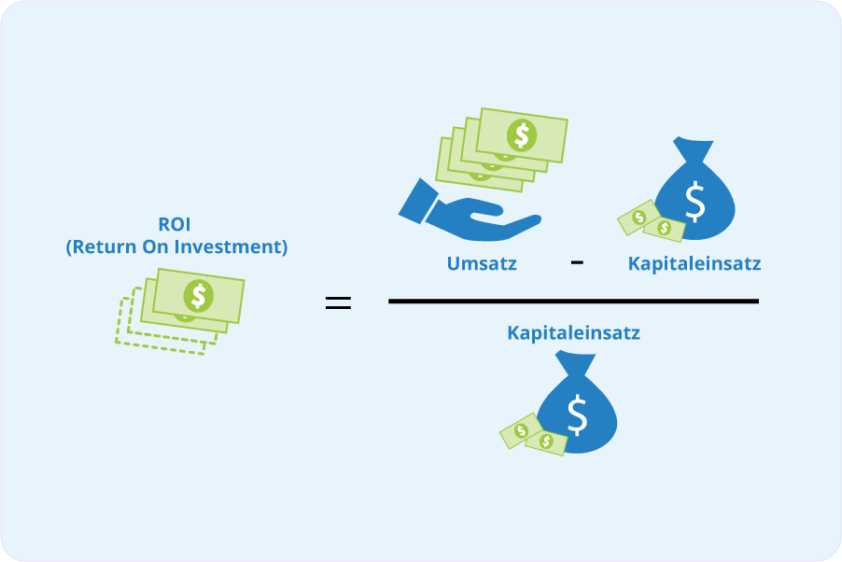
- Conversion Rate: Measures the percentage of users who complete a desired action, such as making a purchase or signing up for a newsletter. Improvements in UX design often lead to higher conversion rates, directly impacting revenue.
- Customer Lifetime Value (CLV): Calculates the total revenue a business can expect from a single customer over their entire relationship. A better UX can lead to higher customer satisfaction and loyalty, increasing CLV.
By translating UX success into financial terms, you can make a strong case for continued investment in UX design.
User Happiness: The Ultimate UX KPI?
While metrics like conversion rates and task completion are important, there’s a growing argument that user happiness might be the ultimate KPI for UX success. After all, a product that leaves users happy is likely to see higher engagement, loyalty, and advocacy:
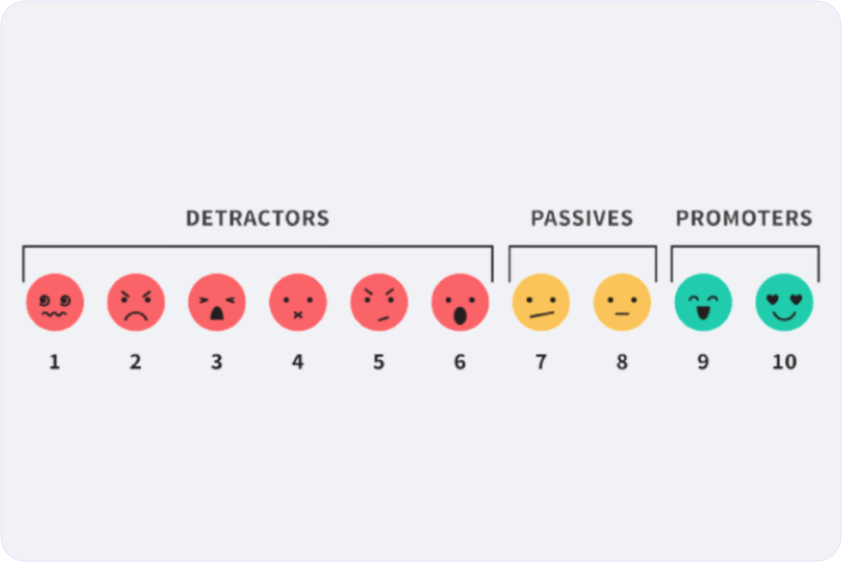
- Net Promoter Score (NPS): Measures how likely users are to recommend a product to others. A high NPS often indicates strong user satisfaction and happiness.
- User Satisfaction Surveys: Direct feedback from users can provide insights into their overall happiness with the product.
- Emotional Response Tracking: Using tools like sentiment analysis, designers can gauge the emotional responses users have to different aspects of the product.
By focusing on user happiness, UX teams can ensure that their designs not only meet functional needs but also create positive, memorable experiences.
Decoding UX Metrics: Turning Data into Actionable Insights
Collecting UX metrics is one thing, but the real challenge lies in interpreting the data and turning it into actionable insights:

- Identify Patterns: Look for trends and patterns in the data that can reveal underlying issues or opportunities for improvement.
- Benchmark Performance: Compare metrics against industry standards or past performance to understand how well the product is doing.
- Prioritize Issues: Use the data to identify and prioritize the most critical issues that need addressing, ensuring that efforts are focused where they will have the greatest impact.
By decoding UX metrics, designers can make informed decisions that lead to continuous improvement and long-term success.
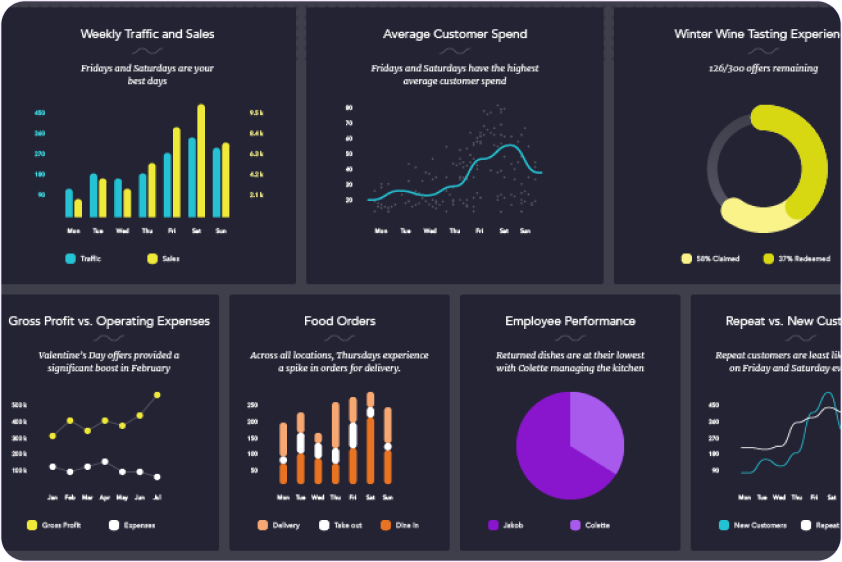
The UX Dashboard: Building a Real-Time View of Success
A UX dashboard is a powerful tool for tracking key metrics in real-time, offering ongoing visibility into UX performance. Here’s how to build an effective UX dashboard:
- Select Key Metrics: Choose the most relevant metrics to track, such as task completion rates, NPS, and user retention rates.
- Use Visual Tools: Employ data visualization tools to present metrics in a clear, intuitive way that’s easy to monitor at a glance.
- Customize for Stakeholders: Tailor the dashboard to the needs of different stakeholders, ensuring that each group has access to the metrics that matter most to them.
With a well-designed UX dashboard, teams can stay informed and agile, making real-time adjustments to optimize the user experience.
Beyond Clicks and Scrolls: Measuring Emotional Engagement in UX
Emotional engagement is a critical yet often overlooked aspect of UX success. While clicks and scrolls provide data on user behavior, emotional engagement offers insights into how users feel about the product:
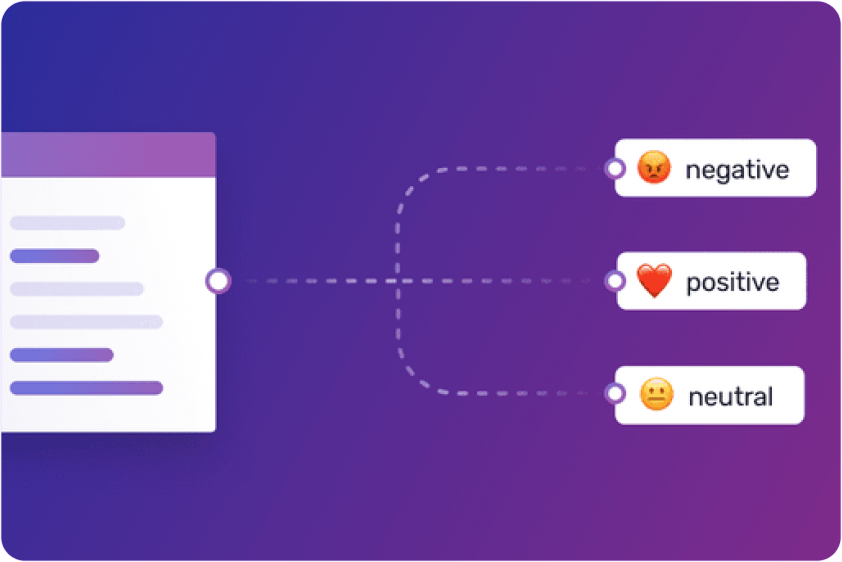
- Sentiment Analysis: Tools like sentiment analysis can track user emotions based on their interactions, revealing how users truly feel about the product.
- Engagement Metrics: Monitor metrics like session duration, repeat visits, and interaction rates to gauge how emotionally engaged users are with the product.
- Qualitative Feedback: Conduct interviews or focus groups to gather direct feedback on users’ emotional experiences with the product.
By measuring emotional engagement, UX teams can ensure that their designs resonate on a deeper level with users, fostering stronger connections and loyalty.
From Analytics to Action: Using UX Metrics to Drive Design Decisions
Data should never just sit in a report; it should drive action. Here’s how to use UX metrics to inform and guide design decisions:

- Iterative Design: Use metrics to inform the iterative design process, making incremental improvements based on data-driven insights.
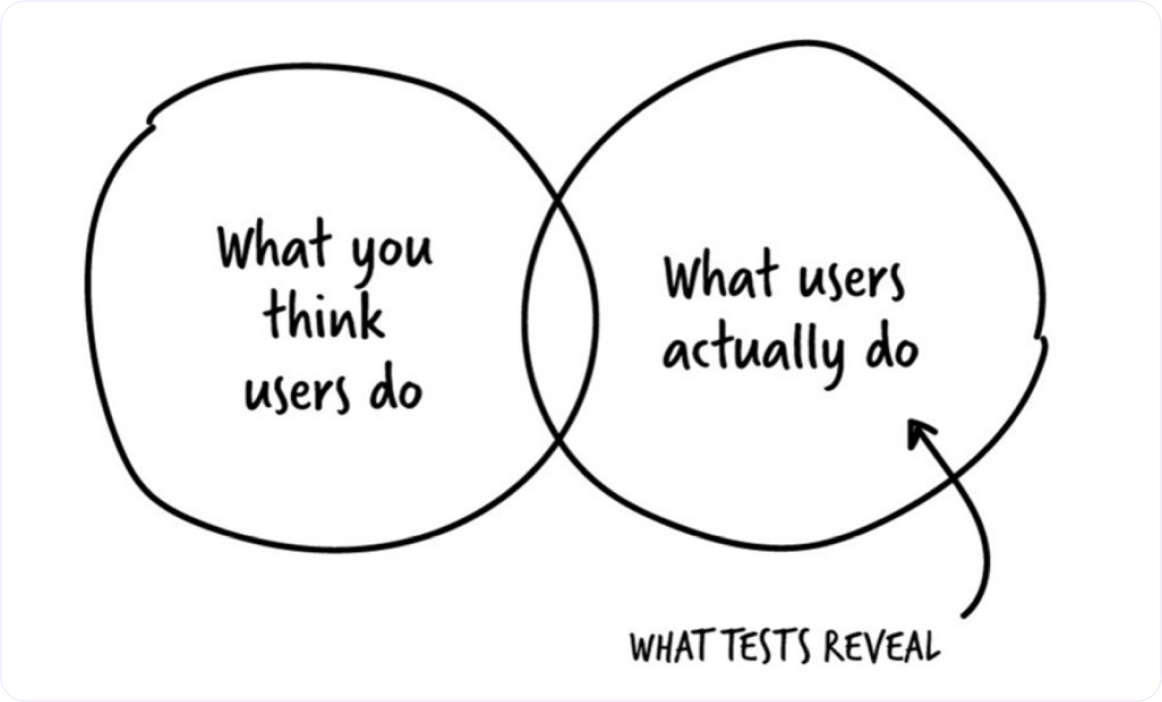
- User-Centered Adjustments: Let user feedback and behavior data guide adjustments to the design, ensuring that changes align with user needs and preferences.
- A/B Testing: Conduct A/B tests to compare different design variations, using metrics to determine which version performs better and why.
By letting metrics guide the design process, UX teams can ensure that their decisions are grounded in reality and focused on delivering the best possible user experience.
Holistic UX Measurement: Balancing Quantitative and Qualitative Metrics
To get a full picture of UX success, it’s important to balance quantitative and qualitative metrics:
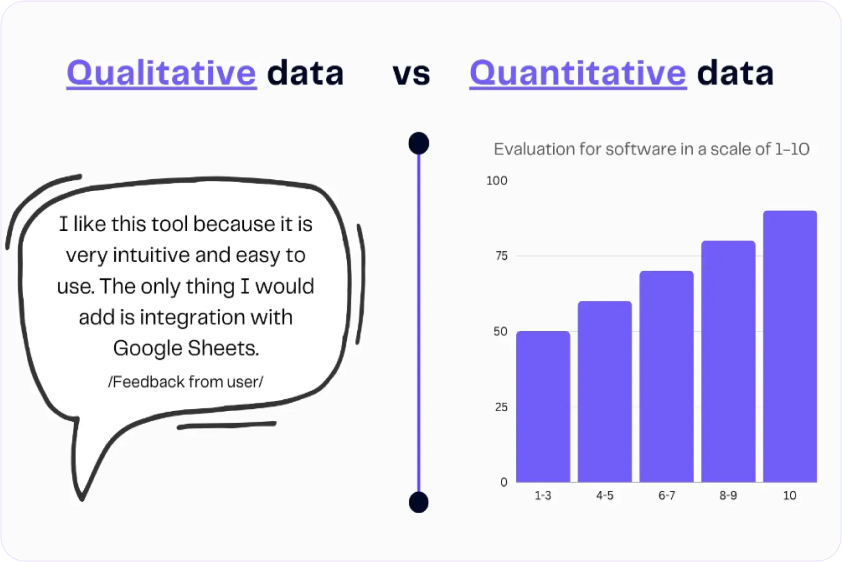
- Quantitative Metrics: These include task completion rates, NPS, and conversion rates, which provide measurable data on user behavior and performance.
- Qualitative Metrics: These include user interviews, open-ended survey responses, and usability testing observations, which offer deeper insights into user experiences and motivations.
By combining both types of metrics, UX teams can gain a holistic understanding of how well their designs are performing and where improvements are needed.
Case Study: How Companies Used UX Metrics to Drive Growth
To illustrate the real-world impact of UX metrics, let’s look at how some companies have successfully used them to drive growth:

- Amazon: Amazon has long been known for its data-driven approach to UX. By closely monitoring metrics like conversion rates, customer satisfaction, and page load times, Amazon has continually refined its user experience, leading to increased sales and customer loyalty.
- Spotify: Spotify uses a mix of quantitative data (like user engagement metrics) and qualitative feedback (from surveys and user interviews) to continually optimize its user interface. This data-driven approach has helped Spotify maintain its position as a leading music streaming service, with high user retention and satisfaction rates.
- Airbnb: Airbnb leverages UX metrics such as booking conversion rates, user feedback, and task success rates to enhance its platform. By making data-informed design decisions, Airbnb has improved its user experience, leading to higher booking rates and user satisfaction.
These case studies demonstrate how UX metrics can be powerful tools for driving business growth when used effectively.
The UX Health Check: Key Metrics for Continuous Monitoring
Regularly assessing the health of a product’s UX is essential for maintaining long-term success. Here’s a checklist of key metrics to monitor continuously:

- User Retention Rate: Measures how many users return to the product over time, indicating long-term satisfaction and loyalty.
- Task Success Rate: Tracks the percentage of users who successfully complete key tasks, providing ongoing insights into usability.
- Error Rate: Measures how often users encounter errors, highlighting potential pain points in the design.
- User Feedback: Regularly collect and analyze user feedback to stay in tune with user needs and expectations.
By keeping a close eye on these metrics, UX teams can proactively address issues and ensure that the user experience remains strong.

 by ideoz